


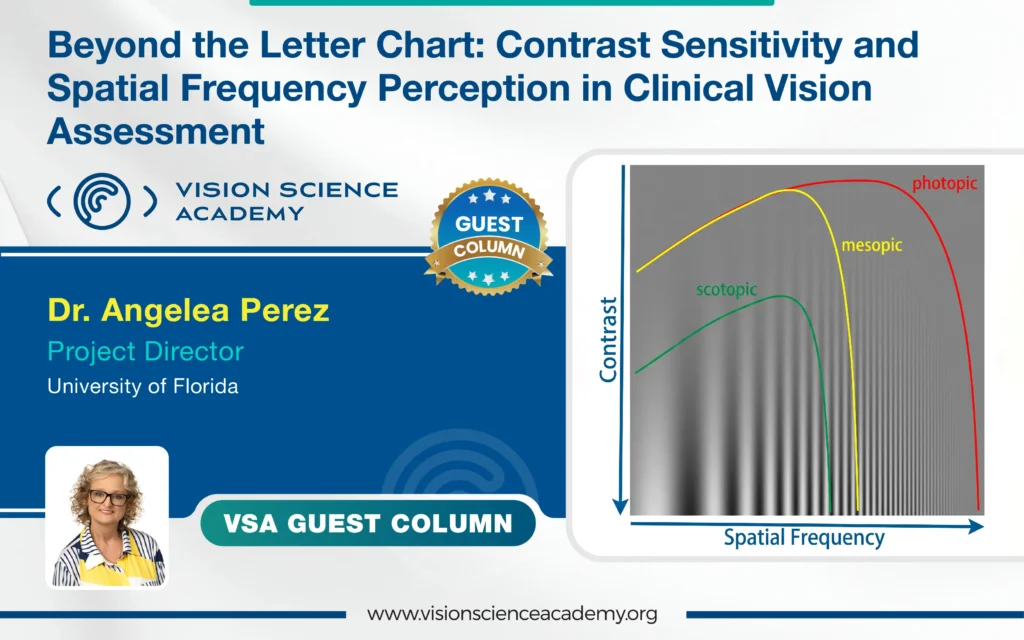
Dr. Angelea Perez, PhD, FAAO
University of Florida; Fellow, American Academy of Optometry
Keywords: contrast sensitivity function; spatial frequency; functional vision; visual acuity; low vision; Pelli-Robson chart
Consider a 68-year-old who reads 6/6 on the letter chart in each eye but has quietly stopped driving after dark and now hesitates on dimly lit stairs. The acuity measurement offers no explanation, yet the complaint is real and increasingly limiting. Cases like this are common, and they expose the central weakness of acuity-based assessment: it asks only what the finest high-contrast detail a patient can resolve is, not how well they see the broader, lower-contrast world they live in.
Visual acuity has long been the primary measure of visual function, yet many patients who struggle to drive at dusk, read in low contrast, or move confidently through unfamiliar spaces retain entirely normal high-contrast acuity. The explanation is the contrast sensitivity function (CSF): a measure that captures the full bandwidth of the visual system’s spatial processing and carries diagnostic information no letter chart can replicate. For Optometry, Ophthalmology and Vision Rehabilitation, a working grasp of contrast sensitivity and spatial frequency perception is not academic decoration, it is central to understanding what patients actually see.
Acuity’s Blind Spot
Contrast is the luminance difference between a target and its background relative to their sum (the Michelson definition for gratings) or to the background alone for letters. Spatial frequency, in cycles per degree (cpd), describes the scale of a pattern: high frequencies are fine, closely spaced bars, while low frequencies are broad bars spanning degrees of arc. Standard 6/6 Snellen acuity is a single high-frequency, high-contrast point, roughly 30 cpd, and is therefore blind to dysfunction at low and intermediate frequencies. Because most everyday tasks (recognising faces, reading under varying light, detecting obstacles) depend on intermediate frequencies at supra-threshold contrast, acuity alone is a poor surrogate for real-world vision. Driving illustrates the point: it is mediated largely by intermediate frequencies under variable and often poor contrast, so two patients with identical acuity can differ widely in how they function behind the wheel.
The Shape of the Function
Plotting the reciprocal of the contrast threshold against spatial frequency on logarithmic axes yields the CSF, which is characteristically band-pass: sensitivity rises from low frequencies, peaks near 2–6 cpd, then falls steeply to the grating-acuity limit around 30–60 cpd (Figure 1).(1)The low-frequency limb is largely neural, lateral inhibition and contrast gain control, while the high-frequency cut-off is set by the eye’s optics (diffraction, aberrations, the modulation transfer function) and the photoreceptor sampling limit. The area under the log CSF (AULCSF) summarises overall sensitivity in one number, but the shape matters more: a uniform reduction suggests global dysfunction, whereas selective losses at particular frequencies point to specific mechanisms, the basis of the test’s differential value. Plotted this way, the curve separates two clinically distinct failure modes at a glance: a drop in overall height versus a narrowing or sideways shift of the usable frequency range.
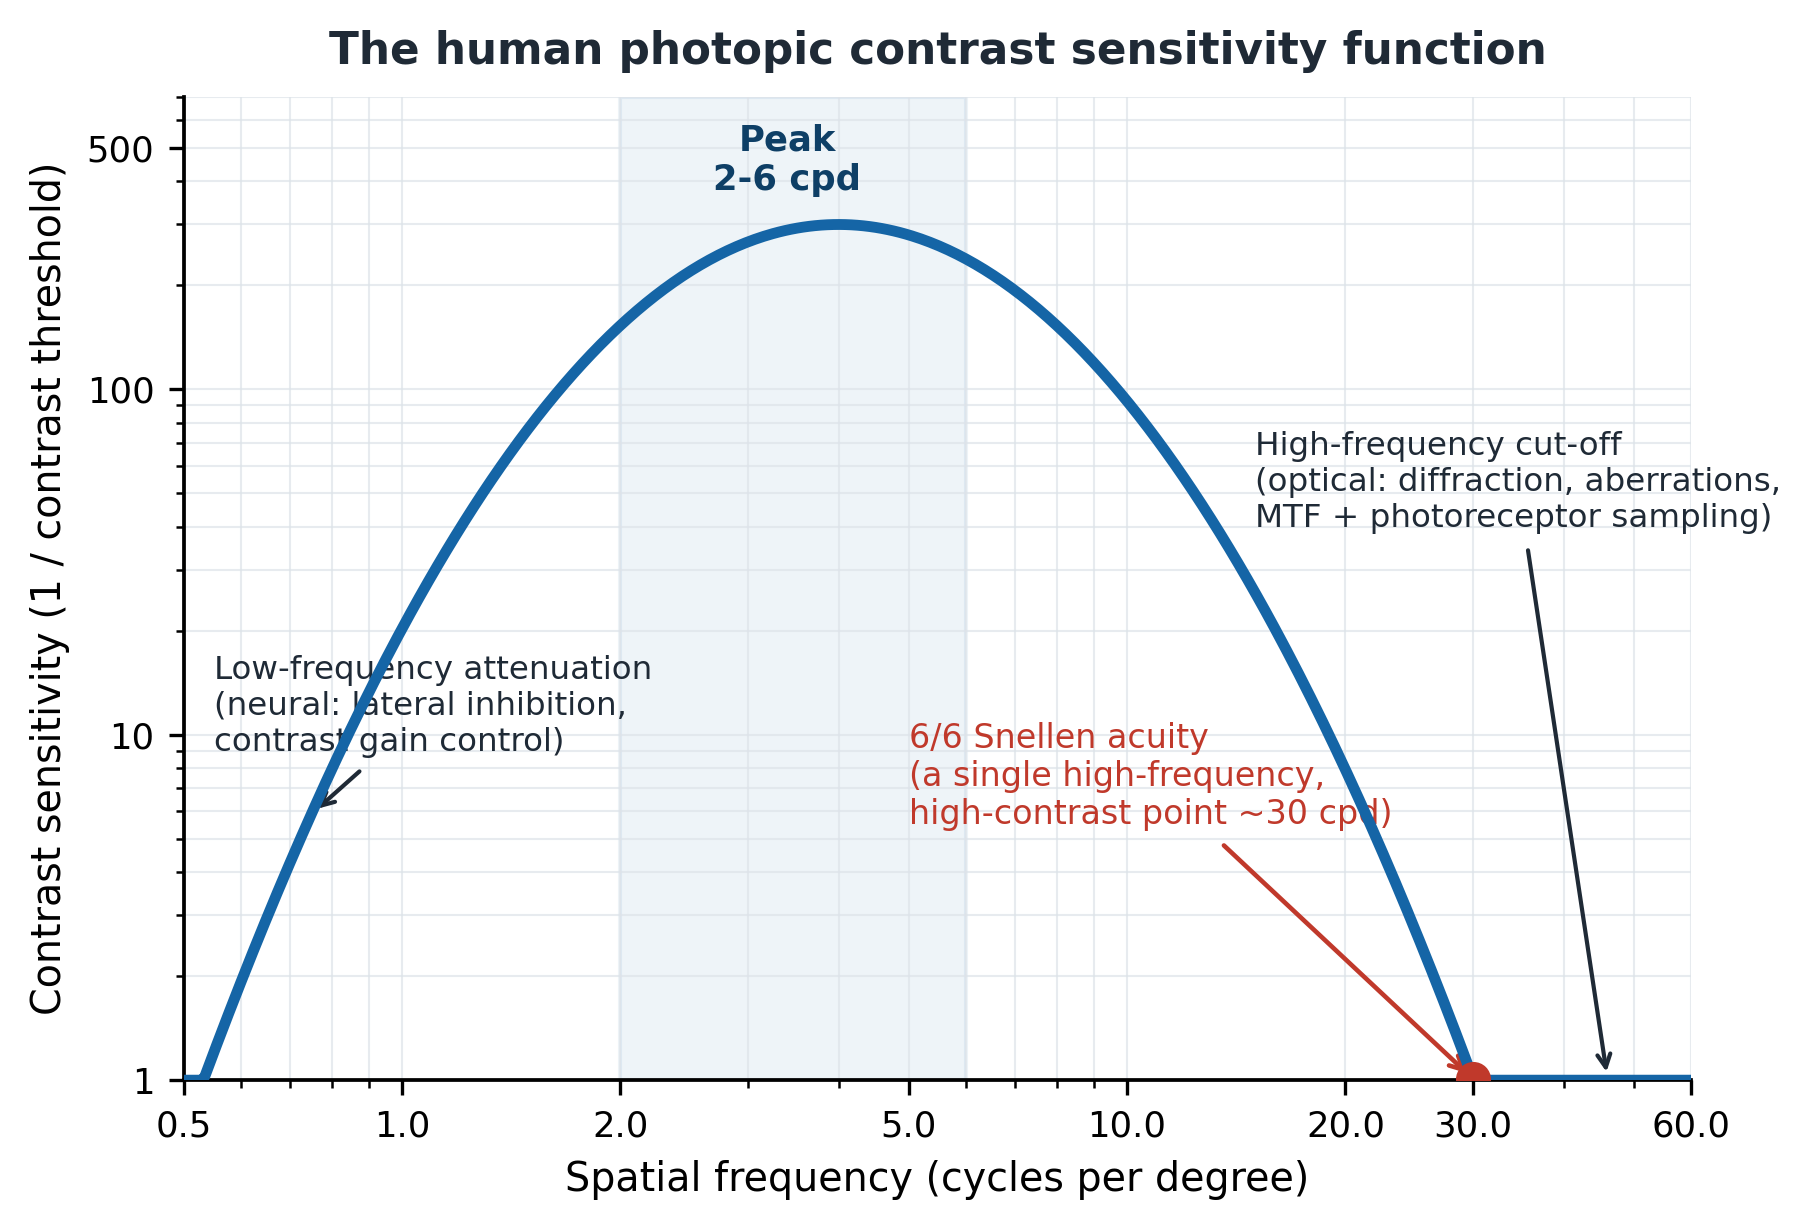

Figure 1: The human photopic CSF. Sensitivity is band-pass, peaking near 2–6 cpd; the low-frequency limb is chiefly neural, the high-frequency cut-off chiefly optical. Standard 6/6 Snellen acuity samples only a single high-frequency, high-contrast point (red).
Image Courtesy: Adapted by Dr. Angelea Perez from established contrast sensitivity function models described by Campbell and Robson (1968) and subsequent vision science literature.
The Neural Architecture Behind the Curve
The CSF reflects multiple quasi-independent channels, each tuned to a narrow band of spatial frequencies, the multi-channel model established by Campbell and Robson. (1) Spatial-frequency adaptation is the classic demonstration: prolonged viewing of one grating selectively raises thresholds at neighbouring frequencies, an effect no single broadband detector could produce. (2) The Campbell–Robson chart makes the whole function visible at once (Figure 2): as frequency rises left to right and contrast falls bottom to top, the height at which the bars vanish traces the CSF.
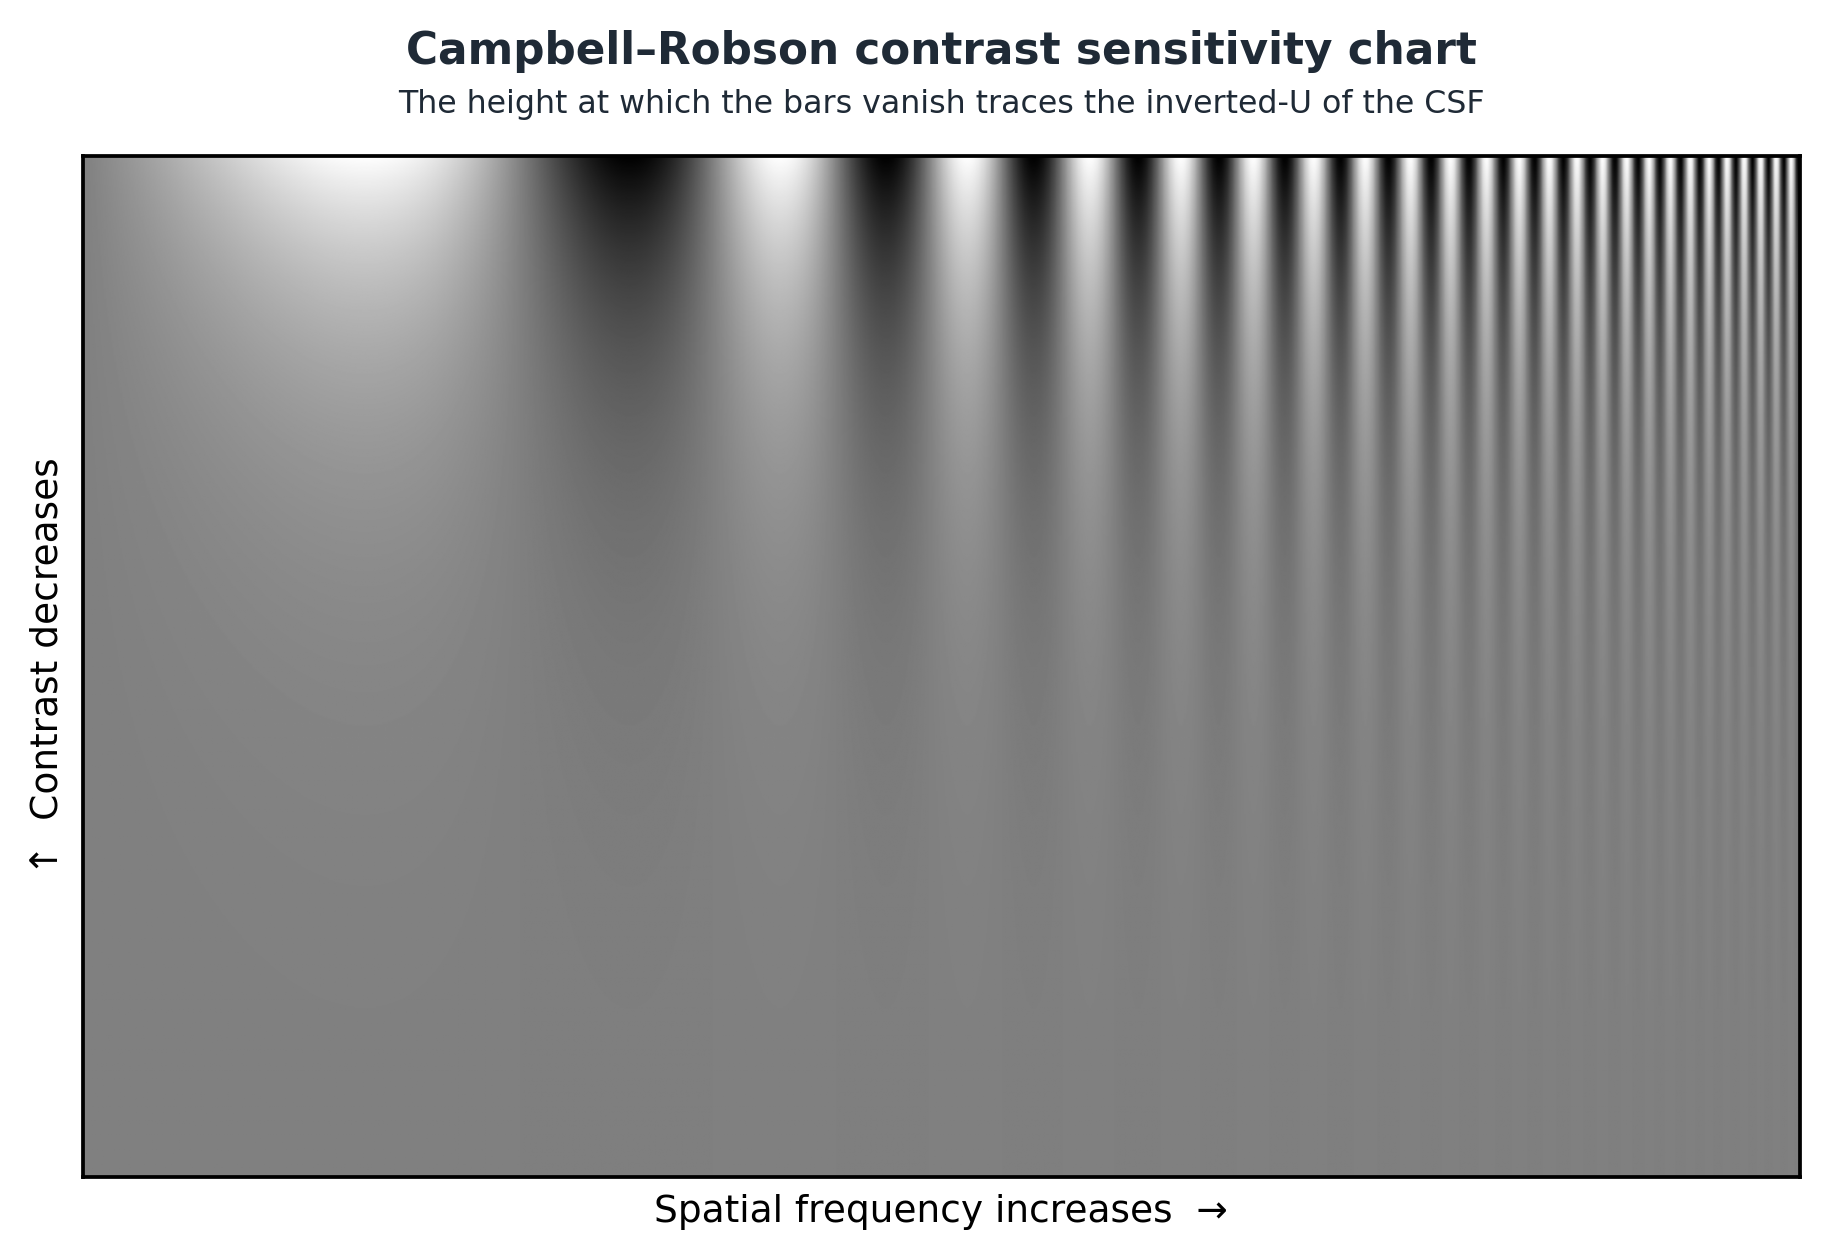

Figure 2: The Campbell–Robson chart: a single image whose visible envelope is the observer’s CSF. (Adapted illustration; courtesy as appropriate.)
Image Courtesy: Adapted illustration based on the Campbell–Robson contrast sensitivity chart originally described by Campbell and Robson (1968).
Two retinogeniculate pathways contribute. Magnocellular neurons have high achromatic contrast sensitivity, broad low-frequency tuning and fast transient responses, suiting motion and coarse analysis. (3) Parvocellular neurons, the majority of lateral geniculate nucleus (LGN) cells, show lower contrast sensitivity but carry fine detail and chromatic contrast, underpinning the high-frequency limb. (3,4) Channel structure also varies across the retina, scaling toward lower frequencies in the periphery in line with cortical magnification, which is why peripheral vision favours coarse pattern and motion over fine detail. The magnocellular–parvocellular distinction is clinically live: early magnocellular loss is implicated in Glaucoma, while parvocellular dysfunction features in Amblyopia and macular disease. (4)
Measuring it in the Clinic
Several validated instruments exist. Grating charts such as the Vistech Contrast Sensitivity Test (Vistech Consultants, Inc., Dayton, OH, USA) and the Functional Acuity Contrast Test (FACT; Stereo Optical Co., Chicago, IL, USA) sample several frequencies but vary in reliability. The letter-based Pelli-Robson Contrast Sensitivity Chart (Haag-Streit/Clement Clarke International, UK) presents triplets of fixed large letters (about 2 cpd) falling in 0.15 log-unit contrast steps and remains the most widely adopted clinical instrument, with good repeatability. (5) The Mars Letter Contrast Sensitivity Test (Mars Perceptrix Corp., Chappaqua, NY, USA) uses finer 0.04 log-unit steps in a portable format,(6) with repeatability comparable to or better than Pelli-Robson.(7,8) For fuller characterisation, Bayesian adaptive methods such as the quick Contrast Sensitivity Function (qCSF; Adaptive Sensory Technology, San Diego, CA, USA) estimate the whole function efficiently, a usable curve from around 100 trials and a broad AULCSF from roughly 25, and have been validated in Amblyopia, AMD and Congenital Cataract. (9)Whatever the tool, forced-choice responding is essential; criterion-dependent yes/no methods add variability that muddies interpretation.
A result is only meaningful against age-appropriate norms and the test’s own repeatability. On letter charts a change of roughly 0.15 log units, about three letters, is usually needed before it can be called real rather than measurement noise, so the same chart, distance and lighting should be used each visit. Wall-mounted charts are quick and inexpensive but sample only a handful of frequencies; computerised adaptive tests reconstruct the entire function and track subtle change more sensitively, at the cost of equipment and chair time. The clinical choice is therefore between a fast-screening estimate and a fuller functional profile.
Disease-specific signatures
The diagnostic power lies in how differently each condition reshapes the curve (Figure 3).
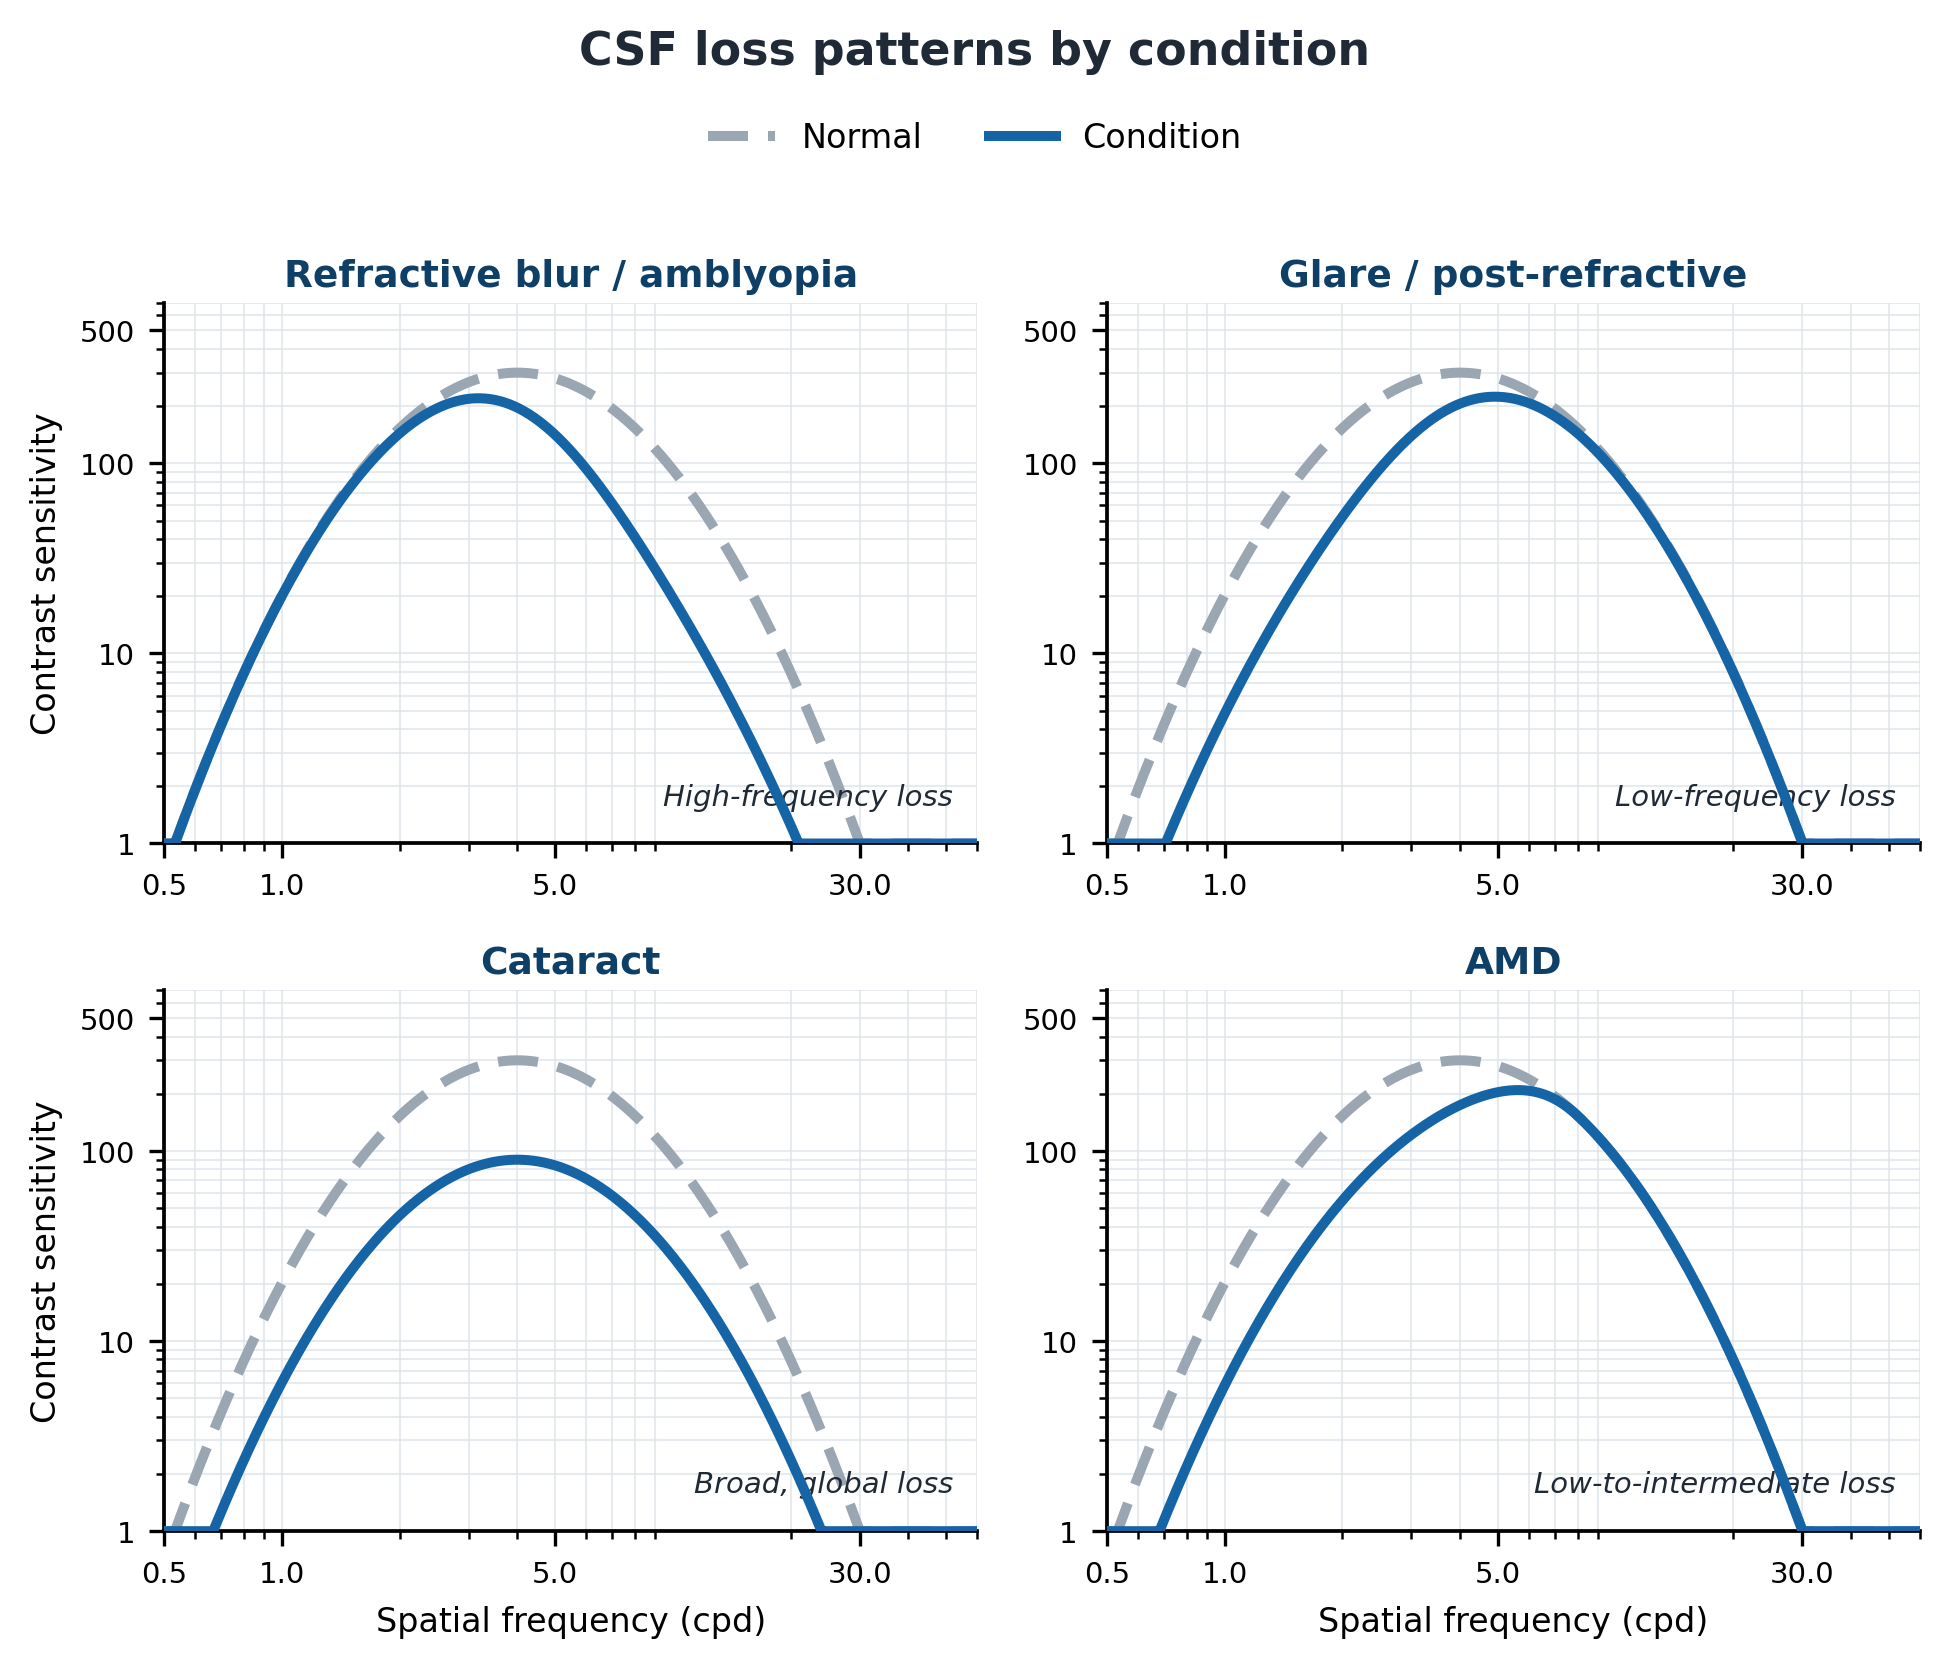

Figure 3: CSF loss patterns by condition (schematic for teaching; not patient data). Each panel overlays the affected curve on a normal reference.
Image Courtesy: Original educational schematic created by Dr. Angelea Perez for teaching purposes; not based on patient data.
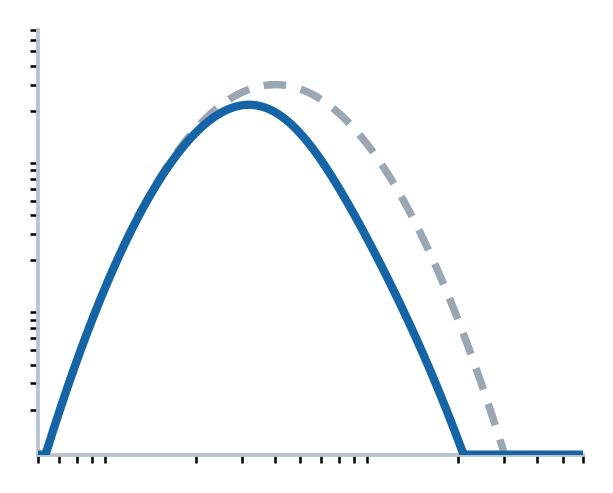 |
Uncorrected refractive error acts as an optical low-pass filter, selectively cutting high spatial frequencies while sparing low and intermediate ones. Amblyopia produces a similar high-frequency loss of neural rather than optical origin, often detectable even when corrected acuity looks good. |
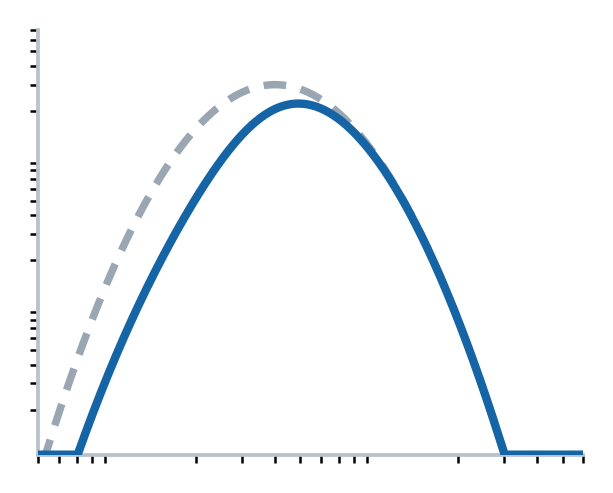 |
Glare, a common complaint after refractive surgery, does the opposite, depressing low-frequency sensitivity while high-frequency acuity is preserved. This explains why a patient can read 6/6 yet still report halos and difficulty in mesopic conditions. |
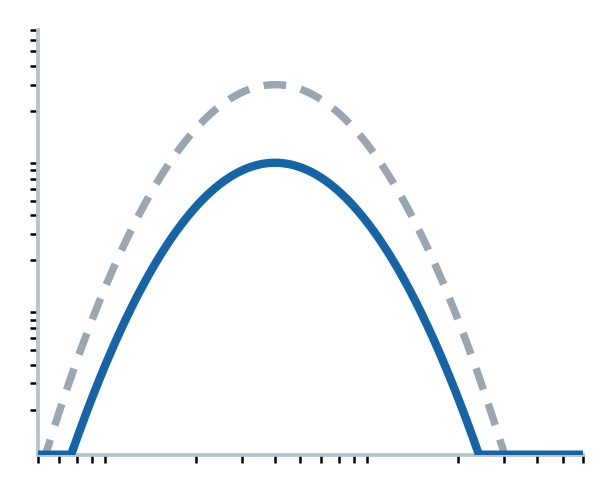 |
Cataract reduces sensitivity broadly through forward light scatter; recovery after surgery often outstrips the Snellen gain, and the improvement in contrast sensitivity can occur independently of the change in acuity, better reflecting the functional benefit patients actually feel.(10) |
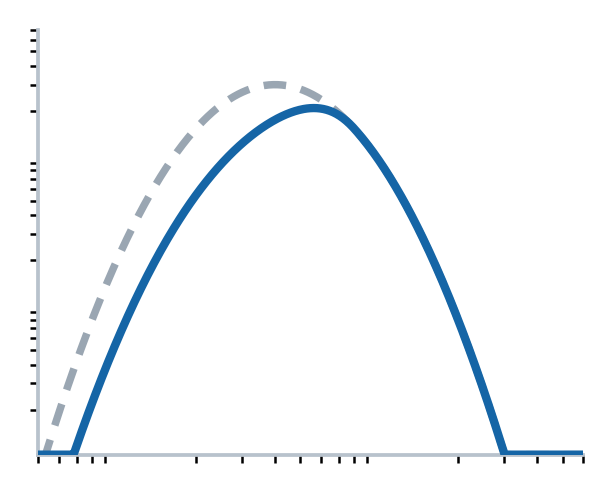 |
Age-related macular degeneration (AMD) preferentially lowers sensitivity to large targets at low-to-intermediate frequencies, mirroring loss of the photoreceptor mosaic that processes that spatial scale. |

Table 1: Characteristic Contrast Sensitivity Function (CSF) Loss Patterns Across Common Ocular Conditions
The schematics illustrate typical patterns of contrast sensitivity loss observed in selected ocular conditions. The dashed curve represents a normal contrast sensitivity function, while the solid curve represents the characteristic reduction associated with each condition. Illustrations are intended for educational purposes only and do not represent patient data. Actual contrast sensitivity profiles may vary among individuals and disease severity levels.
Contrast sensitivity is also reduced early in Glaucoma and ocular hypertension, sometimes before standard perimetric defects are evident, (11,12) and in Multiple Sclerosis, where it can expose ‘hidden’ visual loss in eyes that still read 6/6, (13)as well as in Parkinson’s disease (11) and Alzheimer’s dementia,(14) positioning the CSF as a potential early biomarker of neural dysfunction.
Normal Modulators: Luminance, Age and Eccentricity
Three normal variables set the baseline against which pathology is read. Falling luminance (photopic to mesopic to scotopic) lowers peak sensitivity and shifts it toward lower frequencies, which is why mesopic testing can expose deficits that photopic testing misses. Ageing erodes sensitivity progressively, most at high spatial frequencies, through combined optical (miosis, lenticular change) and neural factors, an argument for routine contrast sensitivity testing beyond age 50, given its links to driving safety and falls. (15,16) Sensitivity also declines with eccentricity, faster for high frequencies than low, a principle that guides preferred-retinal-locus and magnification strategies in low vision rehabilitation.
Putting it into Practice
Contrast sensitivity testing earns its place whenever the history and the acuity disagree. A reasonable default is a letter chart, Pelli-Robson or Mars, at the recommended working distance, with best correction in place and a consistent, well-lit room. A markedly reduced score alongside normal acuity should prompt a careful search for early Cataract, macular or optic-nerve disease, and may justify referral; where the complaint is specifically about dim conditions, mesopic testing can reveal losses that photopic charts miss. Repeating the same test under the same conditions then turns a single number into a means of monitoring change, whether from disease progression or from an intervention such as cataract surgery.
Why the CSF belongs in practice
Across aetiologies, low-vision CSFs can be approximated by a normal curve shifted along the log-frequency and log-sensitivity axes, reduced peak sensitivity and reduced peak frequency capture most of the impairment in just two parameters. (17) Patients who cannot recognise faces, read in dim light, or judge curbs and steps are usually describing contrast sensitivity loss, not acuity loss; sensitivity is reduced in Myopia, glare, Cataract, Amblyopia, AMD, ocular hypertension, Glaucoma and dry eye, frequently while Snellen acuity stays normal. As instruments become faster, more portable and better normed, routine contrast sensitivity testing is increasingly justified. In low vision rehabilitation the same measurements guide magnification and lighting prescriptions, matching the aid to a patient’s residual sensitivity rather than to acuity alone. For the clinician who wants to know not just what a patient can resolve but what they can see, the CSF is indispensable.
Clinical takeaways
- Normal Snellen acuity with real-world complaints, night driving, faces, dim reading, is itself a reason to test contrast sensitivity.
- On the Pelli-Robson chart, a score below about 1.5 log units suggests impairment and below about 1.0 suggests disability.
- Use forced-choice responding and control luminance; consider mesopic testing when the complaint is dim-environment vision.
- Counter Cataract patients that contrast sensitivity recovery often exceeds the Snellen gain, it better reflects the benefit they will feel.
References
- Campbell FW, Robson JG. Application of Fourier analysis to the visibility of gratings. J Physiol. 1968;197(3):551–566.
- Blakemore C, Campbell FW. On the existence of neurones in the human visual system selectively sensitive to the orientation and size of retinal images. J Physiol. 1969;203(1):237–260.
- Kaplan E, Shapley RM. The primate retina contains two types of ganglion cells, with high and low contrast sensitivity. Proc Natl Acad Sci U S A. 1986;83(8):2755–2757.
- Merigan WH, Maunsell JHR. How parallel are the primate visual pathways? Annu Rev Neurosci. 1993;16:369–402.
- Pelli DG, Robson JG, Wilkins AJ. The design of a new letter chart for measuring contrast sensitivity. Clin Vis Sci. 1988;2(3):187–199.
- Arditi A. Improving the design of the letter contrast sensitivity test. Invest Ophthalmol Vis Sci. 2005;46(6):2225–2229.
- Dougherty BE, Flom RE, Bullimore MA. An evaluation of the Mars Letter Contrast Sensitivity Test. Optom Vis Sci. 2005;82(11):970–975.
- Haymes SA, Roberts KF, Cruess AF, et al. The Letter Contrast Sensitivity Test: clinical evaluation of a new design. Invest Ophthalmol Vis Sci. 2006;47(6):2739–2745.
- Lesmes LA, Lu ZL, Baek J, Albright TD. Bayesian adaptive estimation of the contrast sensitivity function: the quick CSF method. J Vis. 2010;10(3):17.
- Elliott DB, Bullimore MA. Comparison of acuity, contrast sensitivity, and disability glare before and after cataract surgery. Arch Ophthalmol. 1993;111(3):327–331.
- Regan D, Neima D. Low-contrast letter charts in early diabetic retinopathy, ocular hypertension, glaucoma, and Parkinson’s disease. Br J Ophthalmol. 1984;68(12):885–889.
- Abu EK, Abraham CH, Dadzie AK, et al. Central contrast sensitivity perimetry discriminates between glaucomatous and non-glaucomatous eyes. Ther Adv Ophthalmol. 2023;15:25158414231208284.
- Regan D, Silver R, Murray TJ. Visual acuity and contrast sensitivity in multiple sclerosis — hidden visual loss: an auxiliary diagnostic test. Brain. 1977;100(3):563–579.
- Cronin-Golomb A, Corkin S, Rizzo JF, Cohen J, Growdon JH, Banks KS. Visual dysfunction in Alzheimer’s disease: relation to normal aging. Ann Neurol. 1991;29(1):41–52.
- Owsley C, Sekuler R, Siemsen D. Contrast sensitivity throughout adulthood. Vision Res. 1983;23(7):689–699.
- Owsley C. Vision and aging. Annu Rev Vis Sci. 2016;2:255–271.
- Chung STL, Legge GE. Comparing the shape of contrast sensitivity functions for normal and low vision. Invest Ophthalmol Vis Sci. 2016;57(1):198–207.
Declaration of interest
The blog is written solely for education purpose, and it does not have any financial support and conflict of interest.
About the Author

Dr. Angelea Perez earned a Master of Arts degree in Visual Impairments from the University of Alabama at Birmingham and a Master of Science degree in Communication Disorders from Texas Woman’s University. She received a Ph.D. in Vision Science with a concentration in visual psychophysics and sensory disabilities. Dr. Perez is also trained in the Orton–Gillingham approach for Dyslexia. Dr. Perez is a published author, instructor, and international speaker, and is the owner of The Sensory Window, a consulting and education organization dedicated to advancing sensory health and functional vision. She received honors as a Helen Keller Fellow and a Fellow of the National Leadership Consortium for Sensory Disabilities. Her areas of interest include technology, clinical research, education, and lifelong learning, with a focus on improving outcomes for individuals with visual and sensory disabilities.